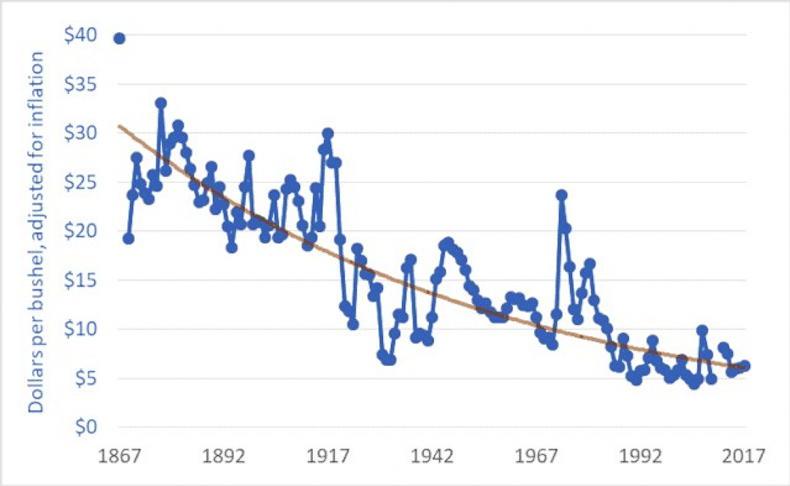
This graph sums up the dilemma facing wheat growers. It gives the real price of wheat over an extended timeframe. As can be seen in real terms, that is if you are looking at what a tonne of wheat can buy in terms of normal consumer goods, its value has fallen by 80% over the last 120 years. Much of that is due to huge advances in productivity, much more efficient ploughing and harvesting technology, and, of course, improved varieties and agro chemicals. But the basic need for farmers to either expand their output or to develop other sources of income to maintain their living standards remains. While most will be familiar with the general trend shown, the fact that cereal prices have now dropped back to 2019 levels and are 20% below this time last year is not so widely known. The Ukraine war-induced price increases have not only been reversed, but have further declined. Input prices have been much more resistant to such dramatic reductions. Where grain goes, other mainline agricultural commodity prices follow in time.
This clear graph explains graphically why there have been farmer protests all over Europe. The static agricultural budget remains, but the aims of the agricultural policy are being continuously expanded to cope with climate change and environmental policies, coupled with a tightening up on what stocking rate can be practised, how much fertiliser can be applied and what and how established agrochemicals can be used.
All of this is accompanied by an ever increasing level of bureaucracy that is difficult to comply with. The mixture is proving toxic. The protests have concentrated political minds, but real solutions will prove much more difficult to put in place. At the same time, we see a new national wage agreement, giving an increase of almost 10% over the next two years.
ADVERTISEMENT
matt column
Register for free to read this story and our free stories.
This content is available to digital subscribers and loyalty code users only. Sign in to your account, use the code or subscribe to get unlimited access.
The reader loyalty code gives you full access to the site from when you enter it until the following Wednesday at 9pm. Find your unique code on the back page of Irish Country Living every week.
CODE ACCEPTED
You have full access to the site until next Wednesday at 9pm.
CODE NOT VALID
Please try again or contact support.
This graph sums up the dilemma facing wheat growers. It gives the real price of wheat over an extended timeframe. As can be seen in real terms, that is if you are looking at what a tonne of wheat can buy in terms of normal consumer goods, its value has fallen by 80% over the last 120 years. Much of that is due to huge advances in productivity, much more efficient ploughing and harvesting technology, and, of course, improved varieties and agro chemicals. But the basic need for farmers to either expand their output or to develop other sources of income to maintain their living standards remains. While most will be familiar with the general trend shown, the fact that cereal prices have now dropped back to 2019 levels and are 20% below this time last year is not so widely known. The Ukraine war-induced price increases have not only been reversed, but have further declined. Input prices have been much more resistant to such dramatic reductions. Where grain goes, other mainline agricultural commodity prices follow in time.
This clear graph explains graphically why there have been farmer protests all over Europe. The static agricultural budget remains, but the aims of the agricultural policy are being continuously expanded to cope with climate change and environmental policies, coupled with a tightening up on what stocking rate can be practised, how much fertiliser can be applied and what and how established agrochemicals can be used.
All of this is accompanied by an ever increasing level of bureaucracy that is difficult to comply with. The mixture is proving toxic. The protests have concentrated political minds, but real solutions will prove much more difficult to put in place. At the same time, we see a new national wage agreement, giving an increase of almost 10% over the next two years.
If you would like to speak to a member of our team, please call us on 01-4199525.
Link sent to your email address
We have sent an email to your address. Please click on the link in this email to reset your password. If you can't find it in your inbox, please check your spam folder. If you can't find the email, please call us on 01-4199525.
ENTER YOUR LOYALTY CODE:
The reader loyalty code gives you full access to the site from when you enter it until the following Wednesday at 9pm. Find your unique code on the back page of Irish Country Living every week.


SHARING OPTIONS