This week we get back to basics on the mechanics of the ICBF bull list and how it is made up.
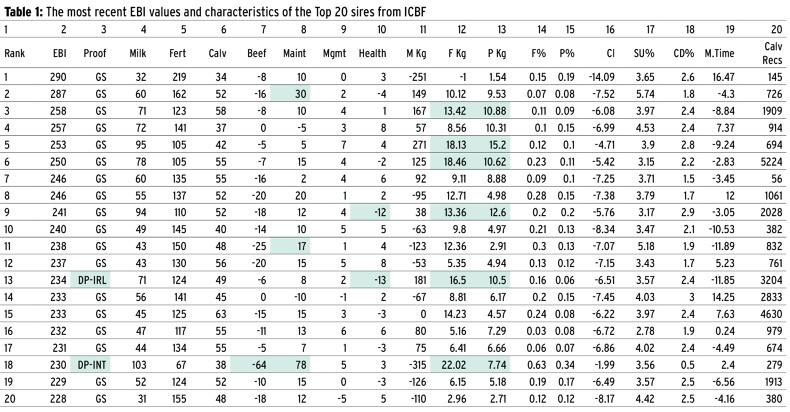
For demonstration purposes, in Table 1 we have selected the top 20 sires from the most recent bull list. The Irish Farmers Journal logged on to ICBF.com, went to publications and then downloaded the “current” list.
An excel file with more than 600 sires opened up with all the figures.
We sometimes take it for granted, but this is the beauty of having the information available and using it to make decisions to suit your own herd.
Irrespective of whether you produce milk in the winter or spring, it is best practice to select sires on milk solids and fertility.
Not that long ago there was an industry debate, with some suggesting that those farmers producing milk during the winter required bulls that had better “type” and “higher volumes”.
Based on comments from some of the top farmers and from those involved in selling semen at this time of the year, it is now clear that selecting sires based on EBI seems to be “a given” at this stage.
A good question that has come up over recent weeks and months is should we still be looking at individual sires?
Given the emphasis on genomic sires in our breeding programme, the game of individual sires is a very dangerous one and now it is all about choosing a team of eight to 10 AI sires. We saw last spring how the numbers can change.
Why they changed is another question.
What’s the danger of selecting just one sire?

If a sire’s EBI falls from €300 to €200 and you have a lot of daughters from that sire in the herd, all your daughters will end up with much lower EBI values.
So, the clear target is you need at least eight to 10 sires for the typical 100-cow herd.
Yes, individual farmers producing winter milk can select within the EBI to improve fertility or milk, but there is an increasing realisation that improved fertility will indirectly improve milk solids production.
Also, there is a growing emphasis on improving fertility and higher fertility will keep cows longer in the herd, delivering more mature yields.
What sires should be selected?
In Table 1, we have deleted some of the columns you will see on the ICBF table to save space for explanation.
There are more than 30 columns in the ICBF table and we have narrowed it down to 20 columns that include bull name, code, breed, AI company, price etc. Individual sires are not the focus – this article is more about discussing the range and meaning of some of the figures available.
 Click here for full-size version of list
Column two shows the overall EBI figure. The point to note is that even in the top 20 sires there is a decent range of €60 – €290 at the top down to €228 for sire number 20.
Remember, this is the difference in profit per lactation, so you ideally need to keep this number as high as you can.
Column three shows whether it is a genomic proof or a daughter proven (DP). You can see there are only two daughter-proven sires in the top 20. Genomic values are pushing these young sires to the top of the list.
Columns four, five and six show the EBI values for milk, fertility and calving. These are three of the seven pillars that make up the overall EBI figure.
Columns seven, eight, nine and 10 show the EBI values for beef, maintenance, management and health. So, what drives the changes in these numbers? Let’s go through them one by one.
For beef, there is an economic value on culls and calves – the more negative the figure, effectively the smaller the cow and the calf. The range in this table is minus €64 to €0.
The minus €64 sire is actually the one Jersey sire (poor beefing characteristics) on the list below. Almost all the Holsteins are breeding negative on beef traits.
Column eight is the maintenance value and you can see the range from €78 to minus €10. The positive figures build into a better EBI, meaning positive is what you want.
You can see those with very negative beef values are getting the higher maintenance values.
Columns nine and 10 then show the management and health values.
The range for management values is small, from minus five to plus seven.
For health, you can see that two sires in the top 20 are significantly lower in values compared with the other sires.
The sires ranked number nine and 13 are minus €12 and minus €13 for health respectively.
Management effectively binds together – milking time and temperament from information sent in by farmers on cows they are milking.
Health is the information that is in the database on lameness, somatic cell count, and mastitis.
For me these figures would effectively mean that these two bulls should not be chosen by any farmer despite the good EBI figures as they are in the bottom 1% for health traits.
You can punch in the code of the sire into the animal search function on ICBF website to see the detailed figures and bar charts for each sire.
The next batch of five columns detail the milk performance figures in terms of milk kg, fat and protein kg, fat and protein percentage. OK, so we see a wide range in the milk kg figure from minus 315kg to plus 271kg.
This is not too much of a concern because if you are picking a team of sires, on average they are probably going to be in or around the 0kg of milk figure.
If you wanted to increase milk solids then you should probably look closer at the next two columns – fat and protein kg – and aim to get over 25kg combined fat and protein.
That stipulation would narrow the top 20 to six and one of those is a Jersey sire, two of them are negative on health, so effectively I’d be down to three sires in the top 20 if aiming for over 25kg combined.

There is no need to dwell on columns 16 and 17.
Essentially both of these show that all the top sires are knocking off days in calving interval and improving survivability, effectively the measures on better fertility. Column 18 is calving difficulty percentage and there is one sire with a CD% of 3, which essentially means he’s not suitable for heifers.
Finally, column 19 and 20 are the milking time statistics from the milk recording data. Measured in seconds, the more negative figures show the faster milkers while the more positive figures show the slightly slower milkers.
Column 20 shows the calving records ranging from as small as 56 records to more than 5,000. Over 50 is the required threshold for a calving evaluation.
Comment
Valuable resource can help farmers make informed decisions
The database of farmer breeding records and decisions taken by herdowners in Ireland is managed by the ICBF. The overall intention of the database is to use a lot of records on individual sires and cows to drive more informed decisions into the future.
All information is freely available allowing the farmer the power to discuss, debate and reason with sales people looking to sell sires.
Yes there are still improvements the ICBF can make to the database including getting more, and better herd health information.
Start with selecting sires on fertility and milk solids and after that start paring back the list depending on traits you need to improve in your own herd and issues like health that can have a big impact.
Read more
How to secure your BDGP money
New online tool for bull buyers and sellers
What you need to be feeding autumn-calving suckler cows
What is the whole herd performance recording and what does it do?
Full winter AI coverage
This week we get back to basics on the mechanics of the ICBF bull list and how it is made up.
For demonstration purposes, in Table 1 we have selected the top 20 sires from the most recent bull list. The Irish Farmers Journal logged on to ICBF.com, went to publications and then downloaded the “current” list.
An excel file with more than 600 sires opened up with all the figures.
We sometimes take it for granted, but this is the beauty of having the information available and using it to make decisions to suit your own herd.
Irrespective of whether you produce milk in the winter or spring, it is best practice to select sires on milk solids and fertility.
Not that long ago there was an industry debate, with some suggesting that those farmers producing milk during the winter required bulls that had better “type” and “higher volumes”.
Based on comments from some of the top farmers and from those involved in selling semen at this time of the year, it is now clear that selecting sires based on EBI seems to be “a given” at this stage.
A good question that has come up over recent weeks and months is should we still be looking at individual sires?
Given the emphasis on genomic sires in our breeding programme, the game of individual sires is a very dangerous one and now it is all about choosing a team of eight to 10 AI sires. We saw last spring how the numbers can change.
Why they changed is another question.
What’s the danger of selecting just one sire?

If a sire’s EBI falls from €300 to €200 and you have a lot of daughters from that sire in the herd, all your daughters will end up with much lower EBI values.
So, the clear target is you need at least eight to 10 sires for the typical 100-cow herd.
Yes, individual farmers producing winter milk can select within the EBI to improve fertility or milk, but there is an increasing realisation that improved fertility will indirectly improve milk solids production.
Also, there is a growing emphasis on improving fertility and higher fertility will keep cows longer in the herd, delivering more mature yields.
What sires should be selected?
In Table 1, we have deleted some of the columns you will see on the ICBF table to save space for explanation.
There are more than 30 columns in the ICBF table and we have narrowed it down to 20 columns that include bull name, code, breed, AI company, price etc. Individual sires are not the focus – this article is more about discussing the range and meaning of some of the figures available.
 Click here for full-size version of list
Column two shows the overall EBI figure. The point to note is that even in the top 20 sires there is a decent range of €60 – €290 at the top down to €228 for sire number 20.
Remember, this is the difference in profit per lactation, so you ideally need to keep this number as high as you can.
Column three shows whether it is a genomic proof or a daughter proven (DP). You can see there are only two daughter-proven sires in the top 20. Genomic values are pushing these young sires to the top of the list.
Columns four, five and six show the EBI values for milk, fertility and calving. These are three of the seven pillars that make up the overall EBI figure.
Columns seven, eight, nine and 10 show the EBI values for beef, maintenance, management and health. So, what drives the changes in these numbers? Let’s go through them one by one.
For beef, there is an economic value on culls and calves – the more negative the figure, effectively the smaller the cow and the calf. The range in this table is minus €64 to €0.
The minus €64 sire is actually the one Jersey sire (poor beefing characteristics) on the list below. Almost all the Holsteins are breeding negative on beef traits.
Column eight is the maintenance value and you can see the range from €78 to minus €10. The positive figures build into a better EBI, meaning positive is what you want.
You can see those with very negative beef values are getting the higher maintenance values.
Columns nine and 10 then show the management and health values.
The range for management values is small, from minus five to plus seven.
For health, you can see that two sires in the top 20 are significantly lower in values compared with the other sires.
The sires ranked number nine and 13 are minus €12 and minus €13 for health respectively.
Management effectively binds together – milking time and temperament from information sent in by farmers on cows they are milking.
Health is the information that is in the database on lameness, somatic cell count, and mastitis.
For me these figures would effectively mean that these two bulls should not be chosen by any farmer despite the good EBI figures as they are in the bottom 1% for health traits.
You can punch in the code of the sire into the animal search function on ICBF website to see the detailed figures and bar charts for each sire.
The next batch of five columns detail the milk performance figures in terms of milk kg, fat and protein kg, fat and protein percentage. OK, so we see a wide range in the milk kg figure from minus 315kg to plus 271kg.
This is not too much of a concern because if you are picking a team of sires, on average they are probably going to be in or around the 0kg of milk figure.
If you wanted to increase milk solids then you should probably look closer at the next two columns – fat and protein kg – and aim to get over 25kg combined fat and protein.
That stipulation would narrow the top 20 to six and one of those is a Jersey sire, two of them are negative on health, so effectively I’d be down to three sires in the top 20 if aiming for over 25kg combined.

There is no need to dwell on columns 16 and 17.
Essentially both of these show that all the top sires are knocking off days in calving interval and improving survivability, effectively the measures on better fertility. Column 18 is calving difficulty percentage and there is one sire with a CD% of 3, which essentially means he’s not suitable for heifers.
Finally, column 19 and 20 are the milking time statistics from the milk recording data. Measured in seconds, the more negative figures show the faster milkers while the more positive figures show the slightly slower milkers.
Column 20 shows the calving records ranging from as small as 56 records to more than 5,000. Over 50 is the required threshold for a calving evaluation.
Comment
Valuable resource can help farmers make informed decisions
The database of farmer breeding records and decisions taken by herdowners in Ireland is managed by the ICBF. The overall intention of the database is to use a lot of records on individual sires and cows to drive more informed decisions into the future.
All information is freely available allowing the farmer the power to discuss, debate and reason with sales people looking to sell sires.
Yes there are still improvements the ICBF can make to the database including getting more, and better herd health information.
Start with selecting sires on fertility and milk solids and after that start paring back the list depending on traits you need to improve in your own herd and issues like health that can have a big impact.
Read more
How to secure your BDGP money
New online tool for bull buyers and sellers
What you need to be feeding autumn-calving suckler cows
What is the whole herd performance recording and what does it do?
Full winter AI coverage

 Click here for full-size version of list


 This is a subscriber-only article


SHARING OPTIONS: