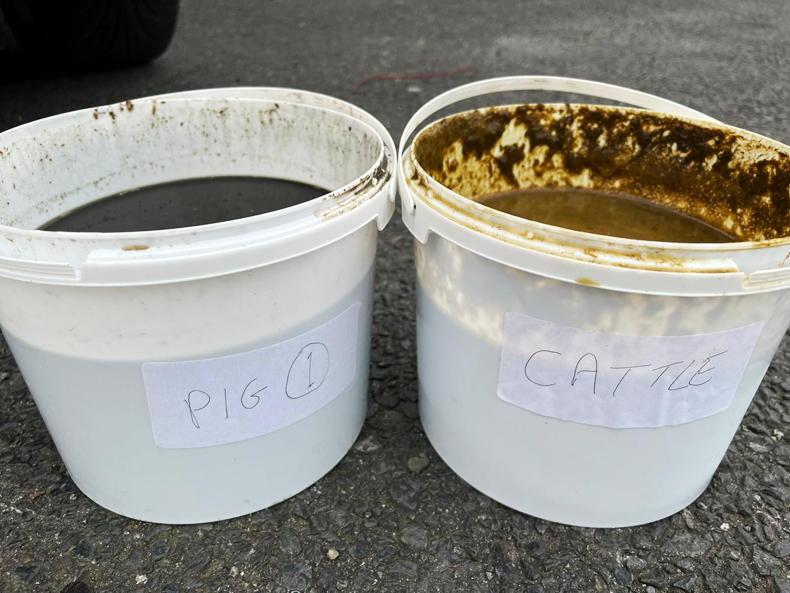
This year, more than ever, farmers are eager to get slurry tested and find out the true nutrient value of that slurry to maximise its use and save on artificial fertiliser application on their farms.
The nutrient content of slurry will vary hugely across farms and it will also vary hugely within farms. Different diets will lead to different nutrient contents. The age of the animals, the quality of silage fed and the ingredients of the rations fed will all affect nutrient content.
For example, bulls or finishing cattle will have a high grain diet, so the phosphorus (P) level is expected to be high in this slurry.
Animals receiving mainly silage over the winter can expect to have slurry with a high K content, provided K was at appropriate levels in the silage.
By testing slurry, it can be targeted at where it is needed most. The slurry with a high P content can be targeted at the lower index P soils, while the slurry with a high K content can be targeted at low K ground.
Figures 1 and 2 show how to calculate the nutrient content of slurry once the sample comes back from the lab.
Table 1 shows the results from the lab and the nutrient content of the slurry in units/1,000 gallons.
Figure 1 shows how to convert the nitrogen percentage to units/1,000 gallons. Nitrogen is expressed as a percentage of the dry matter (DM) content.
The result is first converted to kg/1,000kg. Nitrogen results for slurry are generally returned as Kjeldahl nitrogen. All of this nitrogen is not available to the plant. Availability is generally estimated at approximately 40% and this is why the result is multiplied by 0.40.
The result is then multiplied by nine to convert to units/1,000 gallons.
Figure 2 shows how to convert phosphorus (P) from mg/kg to units/1,000 gallons. The same calculation is used for potassium (K).
The first equation shows how to convert mg/kg to kg/1,000kg. The result is then multiplied by nine to convert to units/1,000 gallons.


SHARING OPTIONS