The collection of farm level data on incomes earned on farms in Ireland only began with the establishment of the National Farm Survey by An Foras Talúntais over 40 years ago. So insights into market and income developments over the last 100 years must rely on national accounts data.
Irish national income accounts for agriculture are only available from 1926-1927, but research by the late Bob O’Connor and Eamon Henry of the ESRI allows us to paint a picture of the evolution of agricultural sector income over the last 100 years.
When comparing economic data over time, it is important to take account of developments in agricultural input and output prices, as well as developments in general price inflation that would have affected the purchasing power of the incomes earned by Irish farmers.
In what follows, agricultural sector income and agricultural sector income per farm are presented in pounds (to account for the two currencies that have existed over the last 100 years) and all real values are expressed in 1929 pounds.
Ag input and output
Both agricultural input and output prices have grown enormously over the last 100 years. In Figure 1, the available indices of agricultural output and input prices are graphed with 2010=100.

It shows the growth in output prices has been largely matched by growth in input prices. The ratio of these two series – the so-called agricultural terms of trade – is also shown, and has moved above and below 100 during the last 100 years. The period before and after accession to the EEC was the high point in terms of Irish agriculture’s terms of trade.
While the terms of trade have followed mostly a downward trend since the early 1990s, it is important to note that the declining output prices since then have been offset by compensatory direct payments to farmers.
Increases in farm incomes have been based on increases in farm scale, improvements in productivity and receipt of subsidy payments.
Income by sector
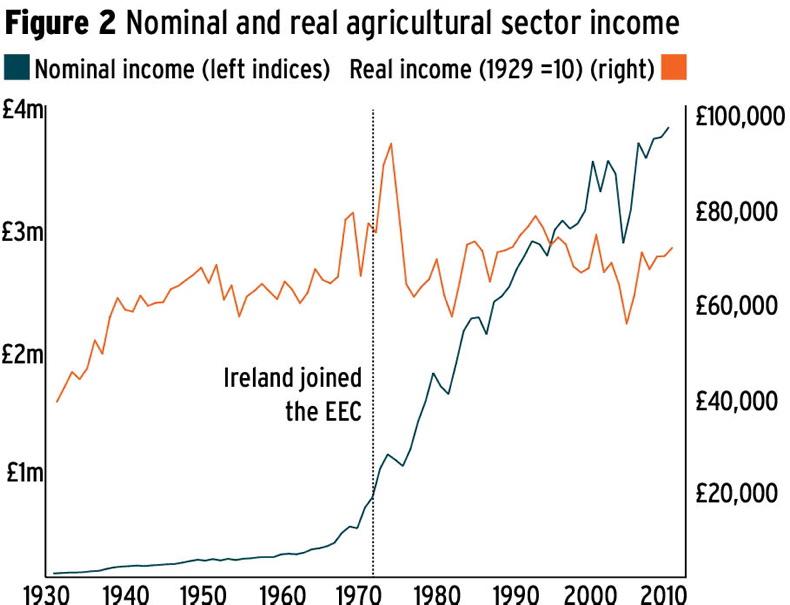
In Figure 2 aggregate sector income earned in Irish agriculture over the period in both nominal and real terms – after taking account of inflation – is presented. What is clear from Figure 2 is that the growth in the nominal value of agricultural sector income has been dramatic, with most growth occuring since Ireland joined the EEC in 1973.
 However, when account is taken of general inflation, the evolution of sector income over the last 100 years is not nearly as dramatic. Between 1918 and 2014 the real value of Irish agricultural sector income has grown by 45%, with most of this occurring up to the late 1970s.
Over a span of 100 years, this is not very impressive. By way of comparison, the real value of the Irish economy increased by over 100% between 1995 and 2014.
Over the last 100 years, there have been dramatic reductions in both the number of farms and those employed in agriculture and to assess how farm-level incomes have developed over the last century account must be taken of the structural change that has occurred.
Irish farm numbers

Figure 3 shows developments over the last 100 years in Irish farm numbers. It’s been a case of steady decline. With a largely stable area farmed and lower numbers of farms, the last 100 years has seen a dramatic increase in average farm size, with the average farm in 2016 over twice as large as in 1916.
With information on aggregate sector income in real terms and total numbers of farms in Ireland over the last 100 years we can estimate how real average sectoral income per farm has developed, as shown in Figure 4.

Over the last 100 years the level of real income per farm has grown by much more than the aggregate sector level of real agricultural income, underlining the importance of structural change to farm level income developments.
When account is taken of changes in the structure of agriculture, the level of agricultural income per farm has increased by over 250% between 1918 and 2014.
The average level of sector income per farm grew very modestly during the 1920s and stagnated during the 1930s as a result of the Depression and economic war with Britain.
During the 1940s incomes grew as a result of increases in the price of agricultural output relative to input costs that arose as a result of World War II.
Agricultural incomes stagnated during the 1950s, with only modest growth due almost exclusively to declining farm numbers.
The most dramatic period of growth was in the decades before and after entry to the EEC, when the combined effects of structural change (fewer farms), improvements in output prices relative to input prices, and productivity growth was reflected in increases in average income.
Over the last 20 years, there has not been significant growth in the real value of agricultural sector income per farm.
This stagnation reflects the slowdown in structural change in agriculture, stable developments in agriculture’s terms of trade and low rates of productivity growth.
Real income per farm
Figure 4 shows real agricultural sector income per farm (£1,929 per farm). If one were to think about the past with an eye to the future 100 years of markets, prices and incomes, what lessons would one draw?
Two lessons seem clear. Firstly, growth in output prices in excess of input prices over the medium to long term is unlikely.
Secondly, structural change and productivity growth were key drivers of farm income growth over the past 100 years and, in all likelihood, these forces will be critical over the next 100 years too. CL