A marginal abatement cost curve (MACC) is a graph that visualises the abatement potential of GHG mitigation measures, and the relative costs associated with each of these measures.
The Teagasc MACC identifies the most cost-effective pathway to reduce GHG emissions and enhance carbon sequestration in the agricultural, land use, land-use change and forestry sectors plus (bio) energy.
The MACC helps stakeholders to make informed decisions about how to allocate resources for emissions reductions. It provides insights into the cost-effectiveness of different abatement options and helps to identify the least costly ways to achieve a given emissions reduction target.
New Teagasc MACC needed
It is important to note that a MACC cannot be static or definitive: the potential for GHG abatement, as well as the associated costs/benefits will change over time as ongoing research programmes deliver new mitigation measures, or as socio-economic conditions evolve.
New agriculture GHG mitigation measures have been added to the current MACC. Additionally, the Russo-Ukrainian war has added considerable volatility in terms of energy and commodity prices.
Changes in climate change policy
The Paris Agreement in 2015 sets out a global framework to avoid dangerous climate change by limiting global warming to well below 2°C and pursuing efforts to limit it to 1.5°C. The following EU policy developments have occurred:
Ireland has committed to achieving the following:
A reduction of 51% in overall GHG emissions from 2021 to 2030 based on 2018 levels and achieving climate neutrality no later than 2050. These legally binding objectives are set out in the Climate Action and Low Carbon Development Act 2021.In 2022, a 25% reduction in GHG emission relative to 2018 was set for the Irish agriculture sector by 2030.The finalisation of the sectoral emissions ceiling for the Land Use, Land-Use Change and Forestry (LULUCF) sector was deferred for 18 months (Q4 2023) to allow for the completion of the Land-Use Strategy.Differences from previous MACC
There are a number of key differences to the previous MACC. These include:
The FAPRI Ireland model has been used to update the animal number projections to 2030. This projects a small decline in the overall bovine herd size. The agricultural efficiency measures (which reduce the carbon footprint but only reduce absolute emissions if the volume of farm output is not increasing) have been separated from those measures that will reduce the absolute emissions. New measures have been added, including age at finishing, feed additives, diversification, etc, and the contribution of some existing measures have been adjusted based on new science (particularly dairy EBI), which has emerged over the last five years and coupled it with forthcoming science.Two adoption pathway levels for measures have been established along three possible scenarios for how animal numbers might evolve.GHG emission projection
The 2030 GHG emissions are estimated to be 22.0 MtCO2e yr-1 for scenario one, 21.2 MtCO2e yr-1 for scenario two and 22.9 MtCO2e yr-1 for scenario three.
How has the potential reduction in
greenhouse gases been calculated?
In order to assess the potential contribution of the Agriculture, Forestry and Other Land Use (AFOLU) sectors, four distinctive MACCs were developed:
Agricultural Mitigation MACC – the reduction potential associated with measures that reduce the total GHG emissions associated with agricultureAgricultural efficiency MACC – the reduction potential associated with measures that reduce the carbon footprint of agricultural produce.Land Use, Land-Use Change and Forestry (LULUCF) MACC – the reduction potential associated with measures that reduce emissions and enhance sinks associated with Land Use, Land-Use Change and Forestry (LULUCF).(Bio)Energy MACC – the fossil fuel CO2 offsetting potential associated with bioenergy or energy-saving measures in the agriculture and LULUCF sectors.For the individual measures, the adoption level was assessed under two alternative levels of ambition.
In contrast to previous MACC analyses, linear rate of uptake for all measures was not assumed. The rate of uptake was tailored for individual measures. Measures already being adopted, eg LESS, were assumed to be taken up more rapidly, while those still under development, eg animal feed additives, were assumed to start slowly and have accelerated rates of uptake in later years.
What are the mitigation potentials associated with agriculture
across the 2021-2030 period?
Agriculture MACC- absolute reduction measures
Measures have the potential to reduce emissions associated with agriculture by between 2820 ktCO2e yr-1 (pathway one) and 4857 ktCO2e yr-1 (pathway two) by 2030. Over the entire period (2021 to 2030), the cumulative emissions reductions potential for agriculture ranges from 13.1m tonnes CO2e to 21.1m tonnes CO2e when each year is summed together. What are the key measures?
What should farmers and policymakers focus on first?
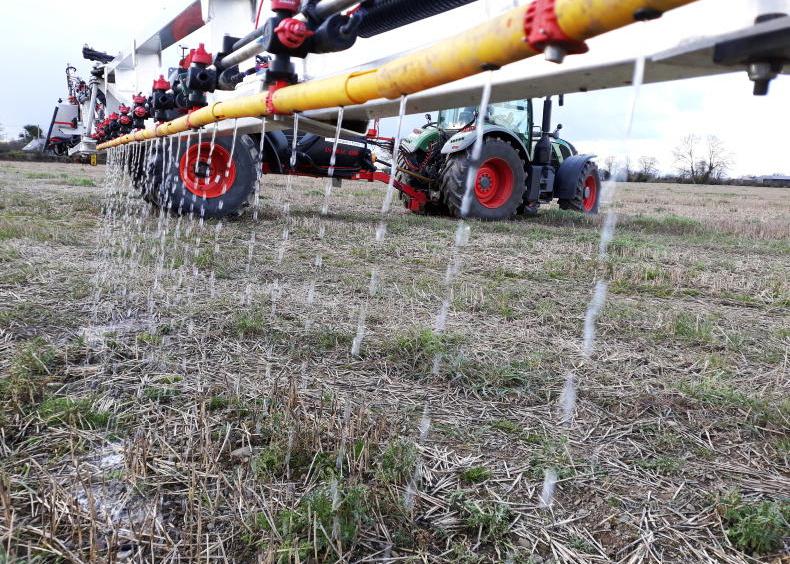
Management of and reductions in use of nitrogen fertilisers should be the first focus. This can be achieved through a combination of reduced N fertiliser application and altered fertiliser formulation (either protected urea or ammonium-based compound fertilisers).Key technologies for achieving a reduction in fertiliser use include the greater use of white and red clover, achieving optimum soil pH and soil P/K fertility status in combination with enhanced use of legumes and multispecies swards and use of low emissions slurry spreading (LESS). These can reduce fertiliser use to between 322,590 tonnes N (P1) and 285,727 tonnes N by 2030 (P2).Altering fertiliser formulation (switching from CAN to protected urea or an ammonium-based compound) will reduce emissions in 2030 by between 418 ktCO2e yr-1 and 553 ktCO2e yr-1. Reduced crude protein in animal feed concentrates will also contribute to reduced nitrogen loading in soils. Manure management, in terms of slurry additives, aeration but also digestate from biomethane facilities could reduce manure ammonia and methane emissions by between 423 ktCO2e yr-1 and 879 ktCO2e yr-1 by 2030. Increased grassland carbon sequestration of between 310 and 555 ktCO2e yr-1 was estimated to be associated with increased liming, multispecies swards and improved soil fertility.What are the key take-home messages?
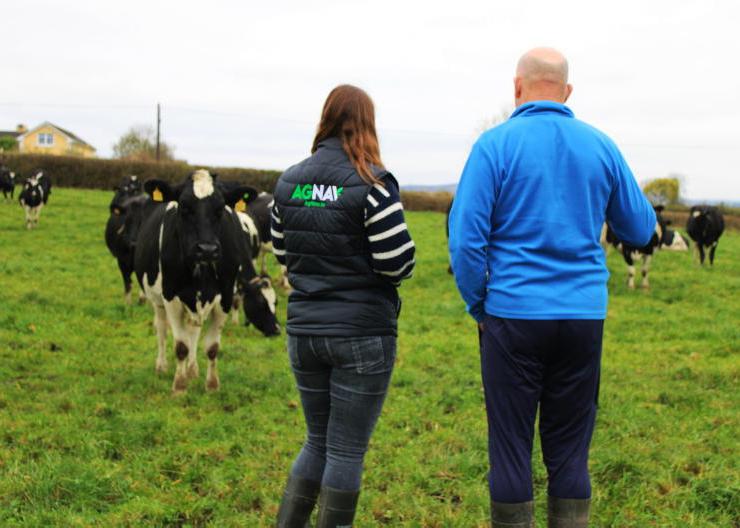
The sectoral target for agriculture can be achieved while maintaining relatively stable agricultural activity levels (scenario one) via an ambitious rate of adoption (pathway two) of identified mitigation measures, and through new science that expands the set of mitigation measures available to farmers Already, nitrogen sales have dropped by 31% since 2021 to 280,569 t N. In terms of the straight nitrogen fertiliser component, 29% was in the form of unprotected urea, 22% was protected urea and 49% was calcium ammonium nitrate (CAN). Advisory and extension services will be key to helping guide farmers and landowners on the path to reduced GHG emissions in 2030 and towards climate neutrality.Continuing research and development of emission mitigation technologies remains a priority to expand and/or enhance the set of mitigation measures available to farmers.The amount of GHG emissions reduction achieved through the adoption of the identified mitigation measures is dependent on both the rate and extent of adoption of the various measures by farmers. The Signpost Programme has launched the 12 Steps to Reduce Farm Greenhouse Gas emissions.
A marginal abatement cost curve (MACC) is a graph that visualises the abatement potential of GHG mitigation measures, and the relative costs associated with each of these measures.
The Teagasc MACC identifies the most cost-effective pathway to reduce GHG emissions and enhance carbon sequestration in the agricultural, land use, land-use change and forestry sectors plus (bio) energy.
The MACC helps stakeholders to make informed decisions about how to allocate resources for emissions reductions. It provides insights into the cost-effectiveness of different abatement options and helps to identify the least costly ways to achieve a given emissions reduction target.
New Teagasc MACC needed
It is important to note that a MACC cannot be static or definitive: the potential for GHG abatement, as well as the associated costs/benefits will change over time as ongoing research programmes deliver new mitigation measures, or as socio-economic conditions evolve.
New agriculture GHG mitigation measures have been added to the current MACC. Additionally, the Russo-Ukrainian war has added considerable volatility in terms of energy and commodity prices.
Changes in climate change policy
The Paris Agreement in 2015 sets out a global framework to avoid dangerous climate change by limiting global warming to well below 2°C and pursuing efforts to limit it to 1.5°C. The following EU policy developments have occurred:
Ireland has committed to achieving the following:
A reduction of 51% in overall GHG emissions from 2021 to 2030 based on 2018 levels and achieving climate neutrality no later than 2050. These legally binding objectives are set out in the Climate Action and Low Carbon Development Act 2021.In 2022, a 25% reduction in GHG emission relative to 2018 was set for the Irish agriculture sector by 2030.The finalisation of the sectoral emissions ceiling for the Land Use, Land-Use Change and Forestry (LULUCF) sector was deferred for 18 months (Q4 2023) to allow for the completion of the Land-Use Strategy.Differences from previous MACC
There are a number of key differences to the previous MACC. These include:
The FAPRI Ireland model has been used to update the animal number projections to 2030. This projects a small decline in the overall bovine herd size. The agricultural efficiency measures (which reduce the carbon footprint but only reduce absolute emissions if the volume of farm output is not increasing) have been separated from those measures that will reduce the absolute emissions. New measures have been added, including age at finishing, feed additives, diversification, etc, and the contribution of some existing measures have been adjusted based on new science (particularly dairy EBI), which has emerged over the last five years and coupled it with forthcoming science.Two adoption pathway levels for measures have been established along three possible scenarios for how animal numbers might evolve.GHG emission projection
The 2030 GHG emissions are estimated to be 22.0 MtCO2e yr-1 for scenario one, 21.2 MtCO2e yr-1 for scenario two and 22.9 MtCO2e yr-1 for scenario three.
How has the potential reduction in
greenhouse gases been calculated?
In order to assess the potential contribution of the Agriculture, Forestry and Other Land Use (AFOLU) sectors, four distinctive MACCs were developed:
Agricultural Mitigation MACC – the reduction potential associated with measures that reduce the total GHG emissions associated with agricultureAgricultural efficiency MACC – the reduction potential associated with measures that reduce the carbon footprint of agricultural produce.Land Use, Land-Use Change and Forestry (LULUCF) MACC – the reduction potential associated with measures that reduce emissions and enhance sinks associated with Land Use, Land-Use Change and Forestry (LULUCF).(Bio)Energy MACC – the fossil fuel CO2 offsetting potential associated with bioenergy or energy-saving measures in the agriculture and LULUCF sectors.For the individual measures, the adoption level was assessed under two alternative levels of ambition.
In contrast to previous MACC analyses, linear rate of uptake for all measures was not assumed. The rate of uptake was tailored for individual measures. Measures already being adopted, eg LESS, were assumed to be taken up more rapidly, while those still under development, eg animal feed additives, were assumed to start slowly and have accelerated rates of uptake in later years.
What are the mitigation potentials associated with agriculture
across the 2021-2030 period?
Agriculture MACC- absolute reduction measures
Measures have the potential to reduce emissions associated with agriculture by between 2820 ktCO2e yr-1 (pathway one) and 4857 ktCO2e yr-1 (pathway two) by 2030. Over the entire period (2021 to 2030), the cumulative emissions reductions potential for agriculture ranges from 13.1m tonnes CO2e to 21.1m tonnes CO2e when each year is summed together. What are the key measures?
What should farmers and policymakers focus on first?
Management of and reductions in use of nitrogen fertilisers should be the first focus. This can be achieved through a combination of reduced N fertiliser application and altered fertiliser formulation (either protected urea or ammonium-based compound fertilisers).Key technologies for achieving a reduction in fertiliser use include the greater use of white and red clover, achieving optimum soil pH and soil P/K fertility status in combination with enhanced use of legumes and multispecies swards and use of low emissions slurry spreading (LESS). These can reduce fertiliser use to between 322,590 tonnes N (P1) and 285,727 tonnes N by 2030 (P2).Altering fertiliser formulation (switching from CAN to protected urea or an ammonium-based compound) will reduce emissions in 2030 by between 418 ktCO2e yr-1 and 553 ktCO2e yr-1. Reduced crude protein in animal feed concentrates will also contribute to reduced nitrogen loading in soils. Manure management, in terms of slurry additives, aeration but also digestate from biomethane facilities could reduce manure ammonia and methane emissions by between 423 ktCO2e yr-1 and 879 ktCO2e yr-1 by 2030. Increased grassland carbon sequestration of between 310 and 555 ktCO2e yr-1 was estimated to be associated with increased liming, multispecies swards and improved soil fertility.What are the key take-home messages?
The sectoral target for agriculture can be achieved while maintaining relatively stable agricultural activity levels (scenario one) via an ambitious rate of adoption (pathway two) of identified mitigation measures, and through new science that expands the set of mitigation measures available to farmers Already, nitrogen sales have dropped by 31% since 2021 to 280,569 t N. In terms of the straight nitrogen fertiliser component, 29% was in the form of unprotected urea, 22% was protected urea and 49% was calcium ammonium nitrate (CAN). Advisory and extension services will be key to helping guide farmers and landowners on the path to reduced GHG emissions in 2030 and towards climate neutrality.Continuing research and development of emission mitigation technologies remains a priority to expand and/or enhance the set of mitigation measures available to farmers.The amount of GHG emissions reduction achieved through the adoption of the identified mitigation measures is dependent on both the rate and extent of adoption of the various measures by farmers. The Signpost Programme has launched the 12 Steps to Reduce Farm Greenhouse Gas emissions. 


SHARING OPTIONS