A recent article on reducing greenhouse gas (GHG) emissions summarised the progress made by the Signpost farmers in adopting a range of recommended climate mitigation technologies on their farms. This article aims to illustrate how these changes in farming practices have impacted on the GHG emissions from the Signpost Farms over the first 24-month period of the Signpost Programme. The article will start by reminding readers of the sources of GHG emissions, before then presenting results.
Calculating a farm’s
GHG emissions
The calculation of a farm’s GHG emissions is not something to be undertaken with a pen and paper.
It typically involves a lot of data (some available from existing databases, e.g. livestock numbers from DAFM AIM database) and some provided by the farmer. For the Signpost farmers, this is gathered by a team of Teagasc NFS data recorders; for other farmers data is gathered through the Bord Bia Sustainability Survey.
Once all the data is available a computation can be conducted through the AgNav platform (www.agnav.ie), yielding individual farmer results for total farm emissions (tonnes CO2eq), emissions per hectare (CO2eq per ha) and emissions per kg product (kg CO2eq per kg fat and protein corrected milk or kg CO2eq per kg liveweight).
The three main drivers of
change in GHG emissions
A farm’s total GHG emissions can be
divided into three categories:
Livestock emissions.Fertiliser use (including lime), manure (storage and spreading), imported feed.Fossil fuels.Once we know this, we can start to explore how changing farm practices impacts on GHG emissions. The remainder of the article will primarily focus on how changes in three factors – fertiliser use, lime use and livestock numbers – impact on total farm GHG emissions.
There are of course other factors which can also play a part, but these are three of the main ones. For example, if the farm increases in size (always possible for an individual farm, but not for the agricultural sector as a whole), then you would expect total emissions to increase (all else remaining unchanged).
Fertiliser use
Table 1 (opposite) presents the fertiliser use on the Signpost dairy farms for 2021 and 2022. Fertiliser type is either urea, protected urea, or CAN and other compounds. Each of these three types of fertiliser has a different emissions factor associated with it. That is, a coefficient that describes the rate at which the use of each fertiliser type releases greenhouse gases (GHGs) into the atmosphere.
There are a number of points to be made from Table 1. Firstly, there was a decrease of 15% in overall usage of fertiliser N between 2021 and 2022 on these farms.
Secondly, there was a change in the proportion of the three different fertiliser types used, with more urea and less CAN used (the availability of fertiliser was a major issue in 2022, and impacted on fertiliser choice by farmers).
These two changes led to an almost 18,000kg CO2eq (or 18 t CO2eq) reduction in the GHG emissions associated with fertiliser use. As these farms, produced approximately 940t CO2eq GHG emissions in 2022, this reduction represents a 2% reduction in total farm GHG emissions.
While Table 1 presents data relating to Signpost dairy farms, similar analysis has been conducted for the other farming enterprises, with summary results presented in Table 1.
Lime usage
The emissions factor associated with lime usage is 0.44 tonnes CO2eq/t of lime applied. If the same amount of lime is applied on an annual basis, then the GHG emissions due to lime application will be unchanged.
However, if a large quantity of lime is applied in one year, then there will be a “spike” in GHG emissions in that year due to a release of CO2.
For example, on the Signpost cattle farms, lime usage increased from 28 to 41 tonnes lime per farm on average between 2021 and 2022, resulting in an increase in GHG emissions of 6.06t CO2eq (14 x 0.44), representing a 1.6% increase in farm GHG emissions.
The application of lime is recommended despite this GHG cost, as optimum soil pH will allow lower fertiliser N application rates and increased N and P use efficiency.
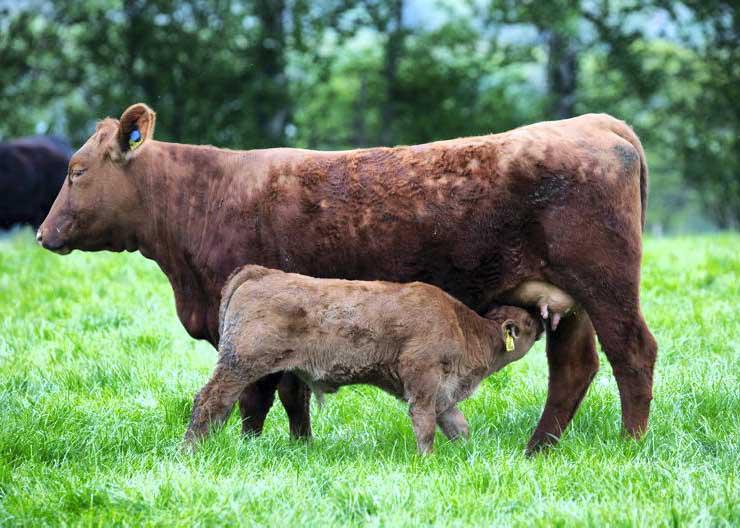
Livestock numbers
Different categories of animals have different emissions factors associated with them. An increase in livestock numbers will lead to increased GHG emissions, calculated as the increase in the animal category multiplied by the associated emissions factor. Average livestock units on all of the livestock Signpost farms increased between 2021 and 2022, leading to increased GHG emissions. In some cases this was due to increased farm size and in another case due to a herd health issue preventing the sale of animals.
Combining the three factors
Figure 1 summarises the changes in three main drivers of change in farm GHG emissions on the dairy, cattle and sheep Signpost farms (data is currently under analysis for tillage and other enterprises). All farms saw a reduction in fertiliser related GHG emissions due to reduced N fertiliser use and a change in the mix of fertiliser types used.
This emissions reduction was counterbalanced by an increase in emissions due to an increase in lime usage and a slight increase in livestock units on the bovine farms, with a somewhat larger increase on the sheep Signpost farms. The change in total farm emissions per hectare farmed is also presented.
In summary, this article has highlighted how three different factors – fertiliser use, lime use and livestock numbers – impact on farm GHG emissions. The Signpost farmers have made significant progress in adopting technologies to reduce their use of fertiliser N, which has led to a reduction in farm GHG emissions.
The Signpost Programme will continue to focus on reducing overall fertiliser N use, increasing the use of protected urea and applying lime as required to optimise soil pH, as well as promoting practices which can lead to a reduction in methane emissions, including calving heifers at two years and optimising the age at finishing.
A recent article on reducing greenhouse gas (GHG) emissions summarised the progress made by the Signpost farmers in adopting a range of recommended climate mitigation technologies on their farms. This article aims to illustrate how these changes in farming practices have impacted on the GHG emissions from the Signpost Farms over the first 24-month period of the Signpost Programme. The article will start by reminding readers of the sources of GHG emissions, before then presenting results.
Calculating a farm’s
GHG emissions
The calculation of a farm’s GHG emissions is not something to be undertaken with a pen and paper.
It typically involves a lot of data (some available from existing databases, e.g. livestock numbers from DAFM AIM database) and some provided by the farmer. For the Signpost farmers, this is gathered by a team of Teagasc NFS data recorders; for other farmers data is gathered through the Bord Bia Sustainability Survey.
Once all the data is available a computation can be conducted through the AgNav platform (www.agnav.ie), yielding individual farmer results for total farm emissions (tonnes CO2eq), emissions per hectare (CO2eq per ha) and emissions per kg product (kg CO2eq per kg fat and protein corrected milk or kg CO2eq per kg liveweight).
The three main drivers of
change in GHG emissions
A farm’s total GHG emissions can be
divided into three categories:
Livestock emissions.Fertiliser use (including lime), manure (storage and spreading), imported feed.Fossil fuels.Once we know this, we can start to explore how changing farm practices impacts on GHG emissions. The remainder of the article will primarily focus on how changes in three factors – fertiliser use, lime use and livestock numbers – impact on total farm GHG emissions.
There are of course other factors which can also play a part, but these are three of the main ones. For example, if the farm increases in size (always possible for an individual farm, but not for the agricultural sector as a whole), then you would expect total emissions to increase (all else remaining unchanged).
Fertiliser use
Table 1 (opposite) presents the fertiliser use on the Signpost dairy farms for 2021 and 2022. Fertiliser type is either urea, protected urea, or CAN and other compounds. Each of these three types of fertiliser has a different emissions factor associated with it. That is, a coefficient that describes the rate at which the use of each fertiliser type releases greenhouse gases (GHGs) into the atmosphere.
There are a number of points to be made from Table 1. Firstly, there was a decrease of 15% in overall usage of fertiliser N between 2021 and 2022 on these farms.
Secondly, there was a change in the proportion of the three different fertiliser types used, with more urea and less CAN used (the availability of fertiliser was a major issue in 2022, and impacted on fertiliser choice by farmers).
These two changes led to an almost 18,000kg CO2eq (or 18 t CO2eq) reduction in the GHG emissions associated with fertiliser use. As these farms, produced approximately 940t CO2eq GHG emissions in 2022, this reduction represents a 2% reduction in total farm GHG emissions.
While Table 1 presents data relating to Signpost dairy farms, similar analysis has been conducted for the other farming enterprises, with summary results presented in Table 1.
Lime usage
The emissions factor associated with lime usage is 0.44 tonnes CO2eq/t of lime applied. If the same amount of lime is applied on an annual basis, then the GHG emissions due to lime application will be unchanged.
However, if a large quantity of lime is applied in one year, then there will be a “spike” in GHG emissions in that year due to a release of CO2.
For example, on the Signpost cattle farms, lime usage increased from 28 to 41 tonnes lime per farm on average between 2021 and 2022, resulting in an increase in GHG emissions of 6.06t CO2eq (14 x 0.44), representing a 1.6% increase in farm GHG emissions.
The application of lime is recommended despite this GHG cost, as optimum soil pH will allow lower fertiliser N application rates and increased N and P use efficiency.
Livestock numbers
Different categories of animals have different emissions factors associated with them. An increase in livestock numbers will lead to increased GHG emissions, calculated as the increase in the animal category multiplied by the associated emissions factor. Average livestock units on all of the livestock Signpost farms increased between 2021 and 2022, leading to increased GHG emissions. In some cases this was due to increased farm size and in another case due to a herd health issue preventing the sale of animals.
Combining the three factors
Figure 1 summarises the changes in three main drivers of change in farm GHG emissions on the dairy, cattle and sheep Signpost farms (data is currently under analysis for tillage and other enterprises). All farms saw a reduction in fertiliser related GHG emissions due to reduced N fertiliser use and a change in the mix of fertiliser types used.
This emissions reduction was counterbalanced by an increase in emissions due to an increase in lime usage and a slight increase in livestock units on the bovine farms, with a somewhat larger increase on the sheep Signpost farms. The change in total farm emissions per hectare farmed is also presented.
In summary, this article has highlighted how three different factors – fertiliser use, lime use and livestock numbers – impact on farm GHG emissions. The Signpost farmers have made significant progress in adopting technologies to reduce their use of fertiliser N, which has led to a reduction in farm GHG emissions.
The Signpost Programme will continue to focus on reducing overall fertiliser N use, increasing the use of protected urea and applying lime as required to optimise soil pH, as well as promoting practices which can lead to a reduction in methane emissions, including calving heifers at two years and optimising the age at finishing.


SHARING OPTIONS