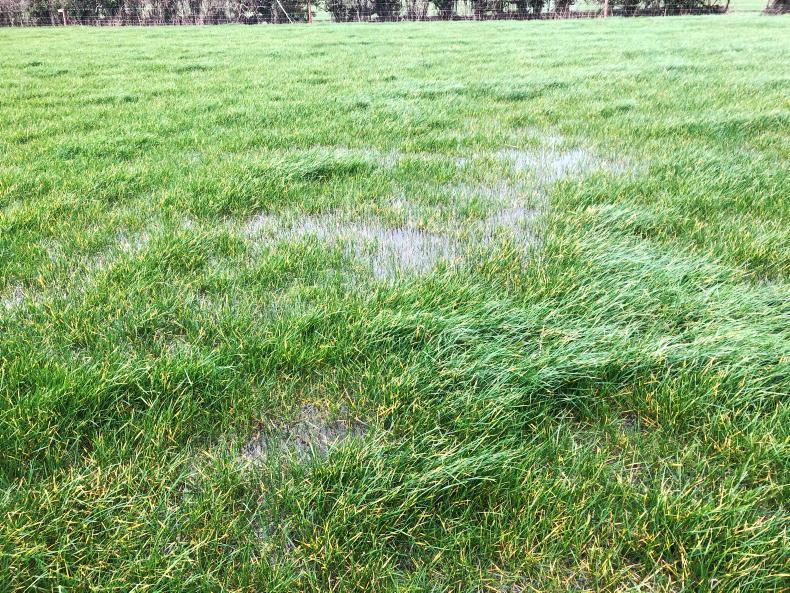
I don’t need to tell anyone that this has been a difficult year for grass production and management. It’s a natural inclination when we experience a bad weather event to treat it as a once off, or, short-lived episode with the expectation that matters will soon revert to normal.
However, with climate change, the fear is that such events may recur with a greater frequency than in the past and hence we’ve to learn to adapt to these changing circumstances. We’re fortunate in this country that climate change has so far not affected us as dramatically as we see now so tragically in other countries.
The prevalence of extreme events, storms and so on, are obvious but more longer term weather factors may be less so.
Patterns
Rainfall and temperature patterns are critically important in the production of all crops, including grass. Underlying shifts in these factors may require farmers to change their management systems to optimise production conditions.
I thought it was worth standing back from recent developments in grass production and taking a longer term look. Fortunately Michael O’Donovan, and his team at Teagasc Moorepark, have set up PastureBase Ireland (PBI) which provides farmers with a digital tool to assist them in managing their grass resources.
This tool, aided by programmes such as Grass10 and supported by advisers, enables farmers to make the most of their grass. It’s disappointing, however, that more farmers don’t make better use of PBI.

PBI has assembled a huge database of grass production data from all over Ireland which contains extraordinary detailed information on growth. I’ve been examining trends and patterns in this data on weekly growth (kg DM/ha/day) performance going back to 2013.
Data is available for each year from the week beginning 27 January to 1 December (45 weeks).
Some interesting long-term patterns emerge from this analysis that I think are worth highlighting. I’m going to focus on data for the Republic as a whole. Naturally variations will exist between regions and indeed, within regions, of the country. I’m working on the proposition that if strong trends are evident at the national level they should be amplified at a regional level.

The annual average weekly grass growth over the 12 years has been about 41.5kg DM/ha/day, or averaged over 45 weeks about 13t per year. Surprisingly there has been a slight downward trend in the average weekly production of about 0.5kg DM per year. Relative to the average weekly level of production, this is only about 1%.
Farmers are very familiar with the seasonal grass production chart which looks like an upside down ‘U’.
When several yearly grass curves are stacked on top of each other, it looks like there’s a lot of inter-year variation.
Most of this is just noise. When you systematically measure variation by comparing the weekly growth variation in each year, relative to the average for that year, you find remarkable stability, with one exception.
No prizes for guessing the outlying year. Naturally it’s 2018.
For all other years, the inter-week variation, standardised for weekly average level of growth, is very similar.
It’s particularly interesting to examine the weekly long-term trends in grass production. From the last week in January to the first week in March, there’s a fairly strong negative trend that ranges from about 2% of the long term average (LTA) for the respective weeks to about 10%. Positive growth trends emerge for the remaining four weeks of March.
Negative weekly trends are again revealed for three of the four weeks of April and also for May and for all of the five weeks of June and up to the second week of July.

For the latter seven weeks, the weekly negative growth rates range from over 1kg to about 2kg. The cumulative negative trend in grass growth for these seven weeks amounts to over 9kg.
The daily growth rate is positive for the last two weeks in July before the trend becomes negative again up to the second week of September. The remaining weeks of September all indicate a positive trend.
For the remaining nine weeks of the growing season, up to the week of 1 December, the trend is again negative for each week.
It’s possible that lower early-season growth and better mid-season growth may reflect the increased use of grass/clover swards, as some farmers who use PBI may have introduced grass/clover to replace nitrogen fertiliser.
Dip in growth throughout the month of June and into July
In summary, over the long run, weekly grass growth trends are negative for 35 weeks and positive for 10 weeks. The biggest absolute dip in growth occurs throughout June and the first two weeks of July. The biggest relative decline (benchmarked against the LTA of grass growth for the weeks concerned) occurs from the last week in January to the first week of March.
Having sweated over the numbers set out above, the reader may ask, so what? It seems to be that there may be a need to focus research on the relative lean weeks at the beginning of the grazing season. Of course the development of strategies to enable better grass utilisation in difficult weather conditions is also required.
I think it’s worthwhile for every farmer to sit down with their adviser, and examine the long-term growth rates on their own farms. This exercise can greatly assist year-to-year and longer-term planning.
I don’t need to tell anyone that this has been a difficult year for grass production and management. It’s a natural inclination when we experience a bad weather event to treat it as a once off, or, short-lived episode with the expectation that matters will soon revert to normal.
However, with climate change, the fear is that such events may recur with a greater frequency than in the past and hence we’ve to learn to adapt to these changing circumstances. We’re fortunate in this country that climate change has so far not affected us as dramatically as we see now so tragically in other countries.
The prevalence of extreme events, storms and so on, are obvious but more longer term weather factors may be less so.
Patterns
Rainfall and temperature patterns are critically important in the production of all crops, including grass. Underlying shifts in these factors may require farmers to change their management systems to optimise production conditions.
I thought it was worth standing back from recent developments in grass production and taking a longer term look. Fortunately Michael O’Donovan, and his team at Teagasc Moorepark, have set up PastureBase Ireland (PBI) which provides farmers with a digital tool to assist them in managing their grass resources.
This tool, aided by programmes such as Grass10 and supported by advisers, enables farmers to make the most of their grass. It’s disappointing, however, that more farmers don’t make better use of PBI.

PBI has assembled a huge database of grass production data from all over Ireland which contains extraordinary detailed information on growth. I’ve been examining trends and patterns in this data on weekly growth (kg DM/ha/day) performance going back to 2013.
Data is available for each year from the week beginning 27 January to 1 December (45 weeks).
Some interesting long-term patterns emerge from this analysis that I think are worth highlighting. I’m going to focus on data for the Republic as a whole. Naturally variations will exist between regions and indeed, within regions, of the country. I’m working on the proposition that if strong trends are evident at the national level they should be amplified at a regional level.

The annual average weekly grass growth over the 12 years has been about 41.5kg DM/ha/day, or averaged over 45 weeks about 13t per year. Surprisingly there has been a slight downward trend in the average weekly production of about 0.5kg DM per year. Relative to the average weekly level of production, this is only about 1%.
Farmers are very familiar with the seasonal grass production chart which looks like an upside down ‘U’.
When several yearly grass curves are stacked on top of each other, it looks like there’s a lot of inter-year variation.
Most of this is just noise. When you systematically measure variation by comparing the weekly growth variation in each year, relative to the average for that year, you find remarkable stability, with one exception.
No prizes for guessing the outlying year. Naturally it’s 2018.
For all other years, the inter-week variation, standardised for weekly average level of growth, is very similar.
It’s particularly interesting to examine the weekly long-term trends in grass production. From the last week in January to the first week in March, there’s a fairly strong negative trend that ranges from about 2% of the long term average (LTA) for the respective weeks to about 10%. Positive growth trends emerge for the remaining four weeks of March.
Negative weekly trends are again revealed for three of the four weeks of April and also for May and for all of the five weeks of June and up to the second week of July.

For the latter seven weeks, the weekly negative growth rates range from over 1kg to about 2kg. The cumulative negative trend in grass growth for these seven weeks amounts to over 9kg.
The daily growth rate is positive for the last two weeks in July before the trend becomes negative again up to the second week of September. The remaining weeks of September all indicate a positive trend.
For the remaining nine weeks of the growing season, up to the week of 1 December, the trend is again negative for each week.
It’s possible that lower early-season growth and better mid-season growth may reflect the increased use of grass/clover swards, as some farmers who use PBI may have introduced grass/clover to replace nitrogen fertiliser.
Dip in growth throughout the month of June and into July
In summary, over the long run, weekly grass growth trends are negative for 35 weeks and positive for 10 weeks. The biggest absolute dip in growth occurs throughout June and the first two weeks of July. The biggest relative decline (benchmarked against the LTA of grass growth for the weeks concerned) occurs from the last week in January to the first week of March.
Having sweated over the numbers set out above, the reader may ask, so what? It seems to be that there may be a need to focus research on the relative lean weeks at the beginning of the grazing season. Of course the development of strategies to enable better grass utilisation in difficult weather conditions is also required.
I think it’s worthwhile for every farmer to sit down with their adviser, and examine the long-term growth rates on their own farms. This exercise can greatly assist year-to-year and longer-term planning.


SHARING OPTIONS