Two of the goals for Signpost farms are to protect and enhance carbon storage and biodiversity on the farm.
Biodiversity on the farms is assessed by the quantity and quality of habitats, and carbon is stored on the farm in the soil and in the plants growing on the farm; the biomass.
This project sets out to establish the percentage of the area of the Signpost farms with biodiversity and the carbon stored on those farms.
In the winters of 2022/2023 and 2023/2024, a total of 92 Signpost farms were surveyed using drone-mounted cameras and
LiDAR is a scanning technology that sends out laser pulses and measures the time it takes for the pulse to be reflected from the surface back to the drone (similar to RADAR). This builds a 3D picture of the farm based on millions of points.
This is also the reason for flying in the winter, as it is more likely for a laser point to strike the ground beneath a tree, or a hedgerow, helping us get a fuller 3D picture. The colour imagery taken by the drone gives a snapshot of the farmland cover and habitats.
Habitats as percentage of total area
The data collected from the LiDAR points is then interpreted by a geo-spatial specialist to create a high-resolution biodiversity map. There are 45 possible labels with land covers, including buildings, improved grassland and crops.
Habitats include heath, scrub and wet grassland.
The habitats as a percentage of the total area are calculated and displayed as a bar chart and as a total percentage (this is not the same calculation as space for nature). Values range from 3% of the farm to more than 15%.
These maps provide a baseline for the farmer and adviser. They show the structure of the habitat assets on the farm and help direct discussion about where and how to improve.
For example, showing where a short length of new hedgerow could go that would improve the overall connectivity of the farm habitats, while also helping potentially to reduce run-off into water courses.
Carbon stored
The maps are also used for the calculation of carbon stored in the woody biomass of the farm: hedgerows, woodland, forest, treelines, scrub and solo trees.
This is done by calculating the exact volume of a hedgerow and using equations developed in Teagasc to convert that volume into biomass, and thus tonnes of carbon.
It is important to think of volume when assessing how much carbon a hedgerow contains, not its length.
A short, tightly managed hedgerow will contain much less carbon (maybe as little as a 10%) than the same length of a wider, taller hedgerow that also has trees within it.

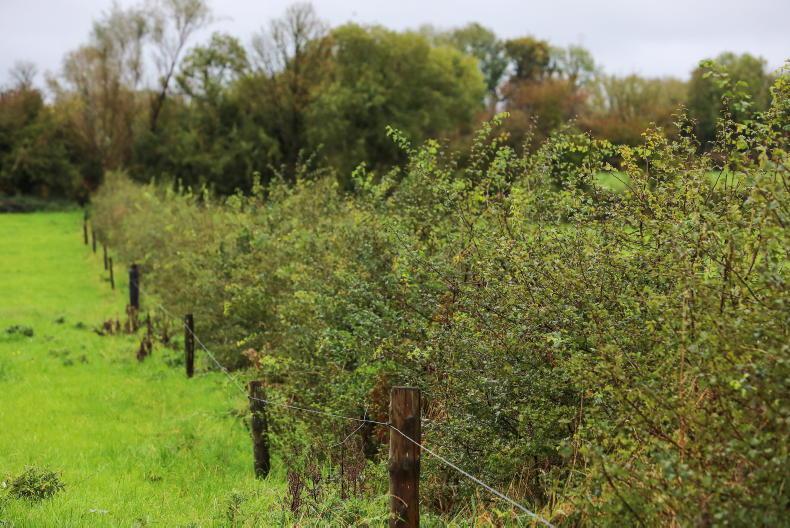
A whitethorn hedgerow is a great plant to store carbon.
It’s important to note that this is carbon stored over the life of the farm. It is not the carbon sequestered annually by the farm biomass.
Below is just one example of hedgerows on a Signpost farm. In one particular field, there are substantial differences in the carbon stored in the hedgerows.
A tall tree-lined hedge with considerable biomass contains 16.2t of carbon on one side. While on the other side of the same field, a very short, topped hedge contains less than 4.1t of carbon.
This is total carbon stored in these hedges, of the same length.
To measure carbon sequestered in these hedgerows would require repeating this exercise in four to five years’ time and calculating the difference in carbon stored, providing a figure on the carbon sequestered per year for the hedgerows.
There is substantial capacity to increase the carbon stored in the second hedgerow. Allowing these types of hedgerows to grow up and out will increase carbon sequestration potential, but also be an asset for biodiversity.
Two of the goals for Signpost farms are to protect and enhance carbon storage and biodiversity on the farm.
Biodiversity on the farms is assessed by the quantity and quality of habitats, and carbon is stored on the farm in the soil and in the plants growing on the farm; the biomass.
This project sets out to establish the percentage of the area of the Signpost farms with biodiversity and the carbon stored on those farms.
In the winters of 2022/2023 and 2023/2024, a total of 92 Signpost farms were surveyed using drone-mounted cameras and
LiDAR is a scanning technology that sends out laser pulses and measures the time it takes for the pulse to be reflected from the surface back to the drone (similar to RADAR). This builds a 3D picture of the farm based on millions of points.
This is also the reason for flying in the winter, as it is more likely for a laser point to strike the ground beneath a tree, or a hedgerow, helping us get a fuller 3D picture. The colour imagery taken by the drone gives a snapshot of the farmland cover and habitats.
Habitats as percentage of total area
The data collected from the LiDAR points is then interpreted by a geo-spatial specialist to create a high-resolution biodiversity map. There are 45 possible labels with land covers, including buildings, improved grassland and crops.
Habitats include heath, scrub and wet grassland.
The habitats as a percentage of the total area are calculated and displayed as a bar chart and as a total percentage (this is not the same calculation as space for nature). Values range from 3% of the farm to more than 15%.
These maps provide a baseline for the farmer and adviser. They show the structure of the habitat assets on the farm and help direct discussion about where and how to improve.
For example, showing where a short length of new hedgerow could go that would improve the overall connectivity of the farm habitats, while also helping potentially to reduce run-off into water courses.
Carbon stored
The maps are also used for the calculation of carbon stored in the woody biomass of the farm: hedgerows, woodland, forest, treelines, scrub and solo trees.
This is done by calculating the exact volume of a hedgerow and using equations developed in Teagasc to convert that volume into biomass, and thus tonnes of carbon.
It is important to think of volume when assessing how much carbon a hedgerow contains, not its length.
A short, tightly managed hedgerow will contain much less carbon (maybe as little as a 10%) than the same length of a wider, taller hedgerow that also has trees within it.

A whitethorn hedgerow is a great plant to store carbon.
It’s important to note that this is carbon stored over the life of the farm. It is not the carbon sequestered annually by the farm biomass.
Below is just one example of hedgerows on a Signpost farm. In one particular field, there are substantial differences in the carbon stored in the hedgerows.
A tall tree-lined hedge with considerable biomass contains 16.2t of carbon on one side. While on the other side of the same field, a very short, topped hedge contains less than 4.1t of carbon.
This is total carbon stored in these hedges, of the same length.
To measure carbon sequestered in these hedgerows would require repeating this exercise in four to five years’ time and calculating the difference in carbon stored, providing a figure on the carbon sequestered per year for the hedgerows.
There is substantial capacity to increase the carbon stored in the second hedgerow. Allowing these types of hedgerows to grow up and out will increase carbon sequestration potential, but also be an asset for biodiversity.


SHARING OPTIONS