In 2007, an article appeared in the Irish Farmers Journal discussing the potential of Ireland having its own breed of cow – the Irish cow. At the time, only one bull in the active bull list was bred in Ireland. The rest originated from New Zealand, the Netherlands and the US.
Ireland was relying on other countries to breed the most suitable sires for us. Irish farmers had no real control over the direction of their breeding programme and this was a big risk.
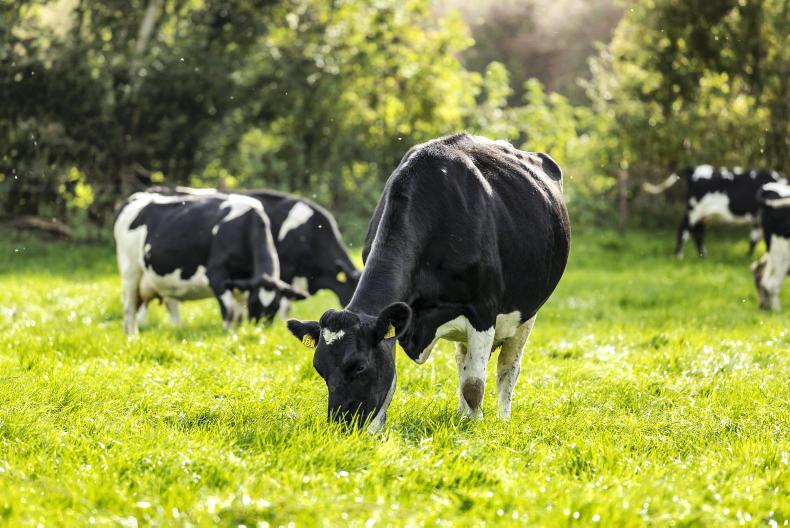
The Irish cow is very much a living, breathing and breeding animal, with Irish genetics now being sold around the world
Thus, the Gene Ireland young bull testing programme was born, designed to identify the best young bulls born in the country and bring them to AI.
In contrast, 13 years later 67 of the 75 bulls in the 2020 active bull list were born in Ireland. The Irish cow is very much a living, breathing and breeding animal, with Irish genetics now being sold around the world. The Irish cow has come a long way, but what direction is she going in and in what areas does she need to improve?
EBI
The average EBI of dairy females in their first year of calving has increased by €12 per year on average over the last 10 years. This rise in EBI is balanced across the milk and fertility sub-indices. This is a high rate of gain, which is good. It shows that high-EBI bulls are available and that farmers are using them. Genomics has facilitated faster identification of high-EBI sires, which has sped up genetic progress.
Score: 8/10
Milk solids
From 2007 to 2009, fat and protein percent in milk sent to processors averaged 3.81% and 3.33% respectively. Fast forward to 2017 to 2019, where fat and protein percent averaged 4.13% and 3.5% respectively, an increase of 0.31% fat and 0.17% protein over 10 years. This compares favourably with an increase of 0.3% fat and only 0.06% protein in the 24 years before 2007.
Some of the yield increases can be explained by more days in milk and higher concentrate feeding levels
Fat percentage is increasing two-and-a-half times faster and protein percent is increasing seven times faster now than it was prior to 2007.
Milk volume is also increasing, with cows producing an average 800l more since 2007. Some of the yield increases can be explained by more days in milk and higher concentrate feeding levels. However, the genetic contribution to increased fat and protein levels is unquestionable.
Score: 8/10.
National fertility
The fertility sub-index makes up 33% of the weighting in EBI, which indicates its importance to a largely seasonal calving national dairy herd. The fertility sub-index has the same weighting in EBI as the milk sub-index, but improvement in on-farm fertility has been much slower than milk solids, as fertility is a less heritable trait.
Over the last 10 years, 11 days have been shaved off calving interval, bringing it to 390 days in 2019, which is still 25 days above the target of 365.
It’s fair to say that not enough herds are achieving fertility targets
The six-week calving rate increased by 13% in the same period, but is still only 65%, well short of the 90% target. The average number of calvings per cow has remained static at an average 3.5 lactations, two lactations short of the target.
It’s fair to say that not enough herds are achieving fertility targets.While the EBI has arrested the decline in fertility, the industry still has a long way to go, both in increasing the rate of EBI gain across all herds and improving fertility management on farms. Score: 5/10
Maintenance/Beef
The maintenance figure within the EBI is contentious. It’s all to do with size – smaller cows have a higher maintenance sub-index, as the index recognises that they have greater feed efficiency. Smaller cows use less feed to maintain themselves and this distributes more feed for production, which has cost and carbon footprint benefits. However, smaller cows have smaller frames and this poses a problem from a beef perspective.
Looking at the EBI of first-calving cows, their maintenance sub-index has remained within the €12 to €14 range for the past 10 years, indicating that the average mature cow weight is around 580kg.
However, eight of the top 10 bulls on the 2020 Active Bull List have a maintenance sub-index of less than €12, indicating that if used across the average cow, their progeny will be larger cows. This is something farmers should be aware of.
Similarly, continuously using high maintenance bulls will breed even smaller cows. The issue needs clear thinking and leadership to be resolved. Score: 5/10
Health
The health sub-index comprises 4% of the weighting in EBI. This is related to lameness, mastitis and SCC. The health sub-index for first-lactation cows has increased by €5 over the last 10 years and now stands at €3 on average.
The main issue with the health sub-index is haphazard recording of data at farm level, which reduces the quantity of data available. As the reliance on antibiotics wanes, the health sub-index will become more important. Score: 6/10
Read more
Picking the genes for this season
Kilfeackle Pivotal tops the list for 2020


SHARING OPTIONS