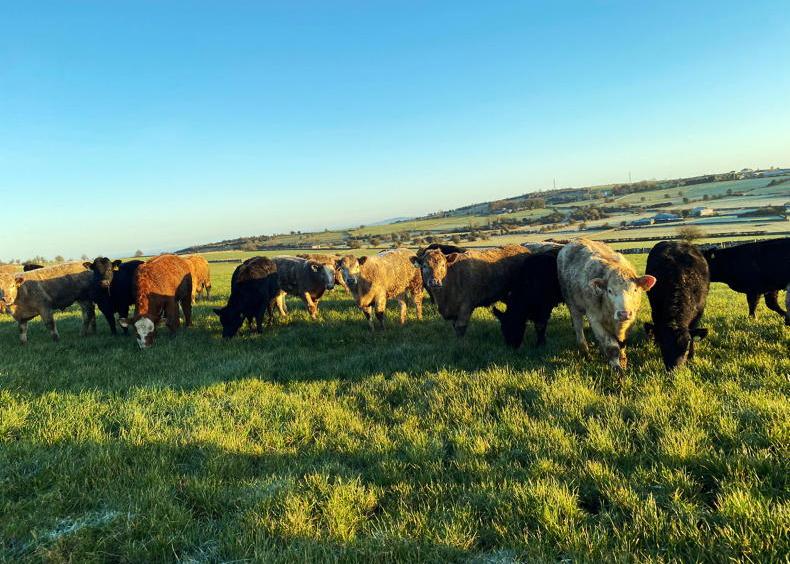
Last week, we carried out clover distribution assessments on Tullamore Farm and some of the Footprint Farms.
Before we started in Tullamore, we chatted with farm manager Shaun Diver and decided on the fields to target, avoiding fields which do not have clover or which we know have extremely low levels of clover present.
These fields will need to receive high nitrogen rates or would need to be reseeded to significantly increase clover levels and reduce nitrogen rates.
It is important to note that Shaun walks the farm regularly when measuring grass and could easily say which field had good clover content and which had no clover at all or very little. If you are not walking the fields, you won’t know.
Avoiding the fields which we knew had no clover quickly cancelled out some of the farm and made the job easier.
Phosphorus and potassium levels are relatively good in Cloona
We headed for the outfarm and grazing block in Cloona. This was converted from tillage to grass in 2017. All land has a soil pH of 6.5 or more, with many fields over 7 in this part of the farm.
Phosphorus and potassium levels are relatively good in Cloona as well, with a majority of paddocks at index 3 or four for at least one element.
Fields were walked in diagonal lines, as was described on this page last week. Some of the long paddocks were walked in a zig-zag pattern, ensuring that a representative assessment of the paddock was completed.
A quadrat was thrown every 20m to 30m and if there was any clover present, it was recorded on a map of the field. If there was one stem or the quadrat was full of clover, then there was clover in the quadrat and therefore the potential to increase clover in that area.
Many of the paddocks had clover distribution of over 80% and 90%. Clover was visible across the fields but walking paddocks and recording distribution on a map clarified this.
Calculate clover distribution
Count the number of scores recorded on your map (the number of times you threw the quadrat).The number of times you record whether or not there is clover will depend on field size and shape.Then count the number of times there was clover present and calculate the percentage.If there was clover present 10 out of 20 times, then the clover distribution is 50%. James Humphreys from Teagasc advises that fields with a clover distribution of 0% to 40% need to be reseeded or high nitrogen rates applied.
Over-sowing could be carried out where there is 40% to 70% distribution and where there is a clover distribution of 70% or over nitrogen could be cut altogether from May or when growth reaches 40kg/ha/day. There are a lot of fields with clover distribution of over 70% in Cloona.
While nitrogen use is being cut on the farm anyway, due to high prices, assessing the fields will allow this to be done in a sensible manner. Cutting out nitrogen completely on a paddock with 90% to 100% clover distribution will allow more nitrogen to be applied to a paddock with no clover.
On some of these fields with high clover distribution, Shaun will cut out nitrogen altogether when growth increases, probably by the end of April.
These fields have received half a bag of protected urea per acre in recent weeks, but will likely not receive anything else.
Although nitrogen will not be cut completely on all fields with high clover distribution, it will be cut back.
High rates
We know clover has a job to do and will not increase while nitrogen is being applied at high rates. However, this method of assessing clover is new to Tullamore Farm, so we won’t throw all our eggs in one basket until we’ve tried it on some paddocks.
You can make up your own quadrat by cutting four 50cm lengths of timber and making a square. The timber could be cut to 25cm lengths to make it easier to carry and it will still allow a representative sample to be checked, but more samples should be taken.Or get a piece of hydrodare pipe or wire, which is measured to 158cm in length and tie it together to form a circle which is 0.2m2. Again, more samples should be taken.Looking at the table, it is important to look at the distribution of clover and also look at the soil sample results. Distribution is often lowest where soil indices are low for P and K.


SHARING OPTIONS